Support and Resistance Indicator Guide | Firstock
Support and Resistance Indicator | Firstock – A Complete Guide
Introduction
When you step into the world of trading, things may initially look chaotic—charts filled with lines, candles, and patterns moving up and down. But what if I told you there's a simple way to understand these movements? That’s where the support and resistance indicator comes in. Think of market prices like a ball bouncing between the floor and the ceiling—the floor is your support, and the ceiling is your resistance. Easy to imagine, right?
In this article, we’ll explore everything about support and resistance indicators, how to use them, why they matter, and how Firstock’s trading app and option trading app help you trade smarter using these tools.
Learn support and resistance indicator, support resistance indicator, and how trading app & option trading app users benefit. A full guide by Firstock.
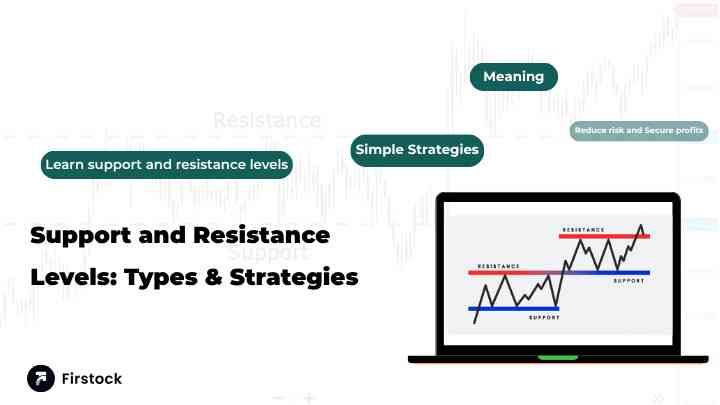
What Are Support and Resistance Levels?
At the heart of every market chart lie two simple yet powerful concepts—support and resistance.
-
Support is the price level where the market tends to stop falling.
-
Resistance is the price level where the market tends to stop rising.
These levels are often created by previous price behavior, trader psychology, and market demand.
Imagine standing in a room. The floor supports you; you can’t go through it. The ceiling resists you; it stops you from going higher. Markets behave the same way.
How Support Works in Trading
Support acts as a safety net for falling prices. It’s the level where buyers step in with confidence.
Why does support form?
-
Buyers find the price attractive.
-
Market considers it a “fair value.”
-
Institutions may place large buy orders near support.
Signals of strong support:
-
Price tests the same level multiple times.
-
Volume increases when price reaches support.
-
Candlestick wicks show rejection from lower levels.
In Firstock’s trading app, support levels are visually highlighted, making it easier to spot key areas.
How Resistance Works in Trading
Resistance works like a ceiling—prices rise until they hit a level where sellers dominate.
Why does resistance form?
-
Traders believe the price is too high.
-
Short-sellers become active.
-
Profit-booking increases.
Signals of strong resistance:
-
Multiple rejections at the same price.
-
Price quickly reverses after touching the level.
-
Selling volume spikes.
Both support and resistance create a battleground where buyers and sellers fight for control.
What Is a Support and Resistance Indicator?
A support and resistance indicator is a tool in charting platforms that automatically identifies support and resistance levels for you.
Instead of manually drawing lines, the indicator uses algorithms to plot:
-
Historical price levels
-
Pivot zones
-
Demand and supply regions
In Firstock’s option trading app, this indicator helps traders analyze market reversal levels even in high-volatility environments.
Types of Support and Resistance Indicators
Different tools help traders identify support and resistance. Here are the most popular ones:
1. Horizontal Support and Resistance Indicators
These show static price levels where price has repeatedly reversed.
2. Pivot Point Indicator
Used widely in intraday trading; calculates support and resistance based on previous day’s price data.
3. Moving Average Indicator
Acts as dynamic support and resistance as price reacts around them.
4. Fibonacci Retracement Indicator
Plots potential reversal levels based on the Fibonacci sequence.
5. Trendline Indicator
Connects swing highs and swing lows to create rising or falling support and resistance.
Each type has its benefits depending on your trading strategy.
Why Traders Rely on Support and Resistance
Support and resistance indicators help traders make better decisions by:
-
Predicting potential price reversals
-
Finding entry and exit points
-
Setting stop-loss and target levels
-
Identifying trend continuation or reversal
-
Reducing emotional decision-making
In simple terms, they simplify trading, especially for beginners.
Using Support and Resistance in a Trading App
When using a trading app, support and resistance indicators make chart reading faster and more efficient.
How it helps:
-
Automatically highlights important price levels.
-
Simplifies buy/sell decisions.
-
Gives alert notifications near key levels.
-
Removes guesswork.
Firstock’s app provides clear visual indicators, making it perfect for traders who want fast decision-making.
Support and Resistance in an Option Trading App
Options trading relies heavily on price direction. Support and resistance help predict movements.
How it benefits option traders:
-
Helps decide strike selection.
-
Identifies breakout or reversal zones.
-
Helps plan long/short option strategies.
-
Supports intraday and positional setups.
In Firstock’s option trading app, indicators are optimized for fast-moving option charts.
Identifying Breakouts and Fakeouts
Support and resistance help traders understand two important market events:
Breakout
When price breaks above resistance or below support with strong volume.
Fakeout
A false breakout where price moves beyond a level but quickly returns back.
How to avoid fakeouts:
-
Wait for candle close beyond the level.
-
Confirm with volume.
-
Use indicator signals within the Firstock app.
Trendlines as Support and Resistance
Trendlines are diagonal lines drawn across rising or falling prices.
Uptrend Support Line
Connects higher lows.
Downtrend Resistance Line
Connects lower highs.
Trendlines show the market direction and act as dynamic support and resistance.
Moving Averages as Dynamic S/R Indicators
Moving averages smooth out price data and show market trends.
Common MAs used as S/R:
-
20 EMA
-
50 SMA
-
200 SMA
How they help:
-
Indicate trend continuation.
-
Reveal bounce zones.
-
Act as dynamic support/resistance in trending markets.
In Firstock charts, moving averages can be added easily to strengthen your S/R analysis.
Fibonacci Levels for Support and Resistance
Fibonacci retracement levels are popular among traders.
Key levels:
-
23.6%
-
38.2%
-
50%
-
61.8%
-
78.6%
These levels act as natural support and resistance because markets often retrace before continuing their trend.
Tips to Use Support Resistance Indicator Effectively
1. Always Confirm with Volume
Strong levels are validated by strong volume.
2. Combine with Trend Direction
Trading with the trend increases accuracy.
3. Look for Multiple Rejections
More rejections = stronger S/R.
4. Don’t Overcrowd the Chart
Focus only on major support and resistance levels.
5. Use Indicators from Firstock App
The app provides:
-
Auto S/R lines
-
Pivot levels
-
Alerts near S/R zones
How Firstock Enhances Support & Resistance Analysis
Firstock’s trading and option trading app is designed to make technical analysis simple.
Key Features:
-
Clean UI with clear charts
-
Auto-drawn support and resistance lines
-
Fast execution for options
-
Professional-grade indicators
-
Real-time data accuracy
-
Custom alerts for S/R breakouts
Whether you're a beginner or a pro, Firstock simplifies your trading decisions.
Common Mistakes to Avoid When Trading with S/R
1. Assuming S/R Always Holds
Levels can break—use stop-loss.
2. Drawing Too Many Levels
Focus on strong ones only.
3. Entering Trades Without Confirmation
Always wait for candle close.
4. Ignoring Trend Direction
Trading against the trend reduces success rate.
5. Not Using a Reliable Trading App
A quality platform like Firstock improves decision-making.
Conclusion
The support and resistance indicator is one of the most powerful tools any trader can use. Whether you're trading stocks, futures, or options, these levels act as a roadmap for price movement. With the right combination of indicators, confirmation signals, and an efficient trading platform like Firstock, you can trade with confidence and clarity.
Support and resistance indicators are not just lines—they are insights into market psychology. Master them, and you’ll understand market behavior on a whole new level.
FAQs
1. What is a support and resistance indicator?
It’s a tool that automatically identifies key price levels where the market tends to reverse or pause.
2. How do support and resistance help in trading?
They help you find entry and exit points, set stop-losses, and predict potential reversals.
3. Are support and resistance indicators useful for options trading?
Yes. Options traders use S/R to identify breakout zones and determine the right strike prices.
4. Which is the best trading app to use support and resistance indicators?
Firstock is highly reliable, offering clear charts, fast execution, and automatic S/R plotting.
5. Can support and resistance levels break?
Absolutely. When strong volume moves through a level, breakouts can occur—sometimes leading to new trends.