

 Downloader
 Free FTP
IMARC Group Soda Ash Price Trend Analysis: Q2 2026 Insights and Outlook
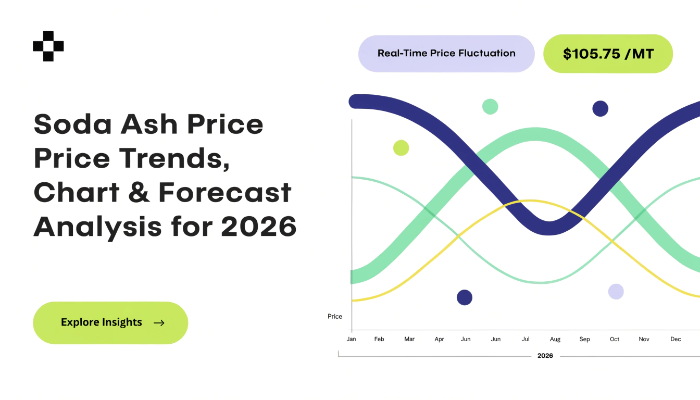
Global Soda Ash Price Outlook – Q2 2026
Soda Ash Price Trend indicates a mild downward movement of approximately 3.5% quarter-over-quarter, driven by easing energy costs and improved supply availability across key producing regions. According to IMARC Group's Q2 2026 price-tracking database and methodology, the market experienced stabilization after prior volatility, with regional variations reflecting localized demand conditions.
For detailed insights and historical benchmarks, refer to the comprehensive IMARC Group Soda Ash Price Trend Analysis .
Price moderation was influenced by balanced supply-demand dynamics, particularly in the glass manufacturing and detergent sectors. While certain regions maintained firm pricing due to steady industrial demand, others saw slight corrections supported by improved production output and reduced freight costs.
Regional Soda Ash Prices Outlook Q2 2026: Where Do Prices Stand?
- USA: USD 279/MT
- Japan: USD 246/MT
- Germany: USD 401/MT
- Indonesia: USD 245/MT
- Argentina: USD 369/MT
The price spread reflects moderate regional disparities driven by production costs and downstream demand. Germany and Argentina show higher price levels due to industrial demand and cost structures, while Indonesia and Japan remain relatively lower-cost markets. The USA sits in the mid-range, indicating balanced domestic supply and stable consumption trends.
Overall, regional performance in Q2 2026 highlights a market transitioning toward equilibrium. Asia-Pacific markets remained relatively stable due to consistent production and export activity. North America showed resilience supported by steady demand from glass and chemicals sectors. South America experienced elevated pricing due to logistics and supply constraints. Collectively, the global market demonstrated reduced volatility compared to previous quarters, with improved supply chains and stable industrial demand supporting pricing consistency across regions.
Country Price Analysis: Where Are Soda Ash Prices Moving?
North America (USA)
The USA recorded USD 279/MT, reflecting a slight downward trend during Q2 2026. Stable production levels and moderate demand from the glass industry contributed to price softening. Improved logistics and lower natural gas costs also supported reduced pricing pressure.
Asia-Pacific (Japan, Indonesia)
Japan reported USD 246/MT, while Indonesia stood at USD 245/MT, both indicating stable to slightly declining trends. Strong supply availability and controlled demand from detergents and glass manufacturing kept prices relatively steady. Export-oriented production in the region ensured sufficient supply.
South America (Argentina)
Argentina recorded USD 369/MT, showing a firm pricing trend compared to other regions. Higher production costs and logistical challenges supported elevated price levels. Demand from industrial applications remained consistent, contributing to price stability.
Supply And Demand Overview – Q2 2026
Supply conditions in Q2 2026 improved due to stable production across major manufacturing hubs. Natural soda ash producers maintained consistent output, while synthetic production benefited from lower energy costs compared to previous quarters.
Demand remained steady across key end-use industries such as glass manufacturing, detergents, and chemicals. Flat glass demand, particularly from construction and automotive sectors, played a critical role in maintaining baseline consumption levels.
Procurement strategies shifted toward shorter contract cycles, reflecting increased confidence in supply stability. This contributed to improved market liquidity and reduced price volatility, especially in Asia-Pacific markets.
Soda Ash Price Index & Historical Analysis: How Has the Market Evolved?
The Soda Ash Price Index in Q2 2026 showed a gradual decline compared to Q1, aligning with easing cost pressures and improved supply availability. The index trend indicates a transition from a high-cost environment to a more balanced pricing structure.
Historically, soda ash prices have been closely linked to energy costs and industrial demand cycles. Compared to the previous quarter, the current index movement reflects reduced volatility and improved supply-demand alignment.
The Soda Ash Price Chart over the past year highlights a peak in late 2025 followed by gradual correction in early 2026. This trend underscores the cyclical nature of the market, with stabilization observed in Q2 as supply chains normalized and demand remained consistent.
Soda Ash Price Forecast 2026: What Should Buyers Expect?
Over the next 12 months, prices are expected to remain stable with a slight downward bias of 2–4%, depending on regional demand conditions and energy cost fluctuations.
Key forecast drivers include:
- Stable demand from glass and detergent industries
- Continued improvements in production efficiency
- Moderate energy price trends
- Balanced global supply levels
IMARC Group projects that the market will maintain equilibrium, with limited volatility and gradual adjustments based on macroeconomic conditions.
Key Factors Affecting Prices: Quarterly Perspective
Several factors influenced pricing during Q2 2026:
- Energy costs: Lower natural gas and electricity prices reduced production costs
- Glass industry demand: Consistent consumption supported baseline pricing
- Freight and logistics: Improved shipping conditions reduced transportation costs
- Production capacity: Stable output from major producers ensured supply availability
- Trade flows: Balanced import-export dynamics minimized regional price disruptions
These factors collectively contributed to the observed price stabilization and slight downward trend.
What Is Soda Ash?
Soda ash, also known as sodium carbonate, is an essential industrial chemical used primarily in glass manufacturing, detergents, and chemical processing. It is produced either through natural mining (trona) or synthetic processes such as the Solvay method.
Its widespread use in industrial applications makes it a critical raw material, with demand closely tied to construction, automotive, and consumer goods sectors.
Recent Developments (Q2 Highlights)
- Stable production output from major soda ash producers globally
- Expansion of natural soda ash mining capacity in North America
- Improved logistics and reduced freight costs across key trade routes
- Steady demand from flat glass manufacturers
- Increased focus on sustainable and energy-efficient production methods
These developments indicate a market moving toward long-term stability and efficiency.
Get the Latest Price Data – Request Your Sample Report:
https://www.imarcgroup.com/soda-ash-pricing-report/requestsample
FAQs About Soda Ash Price Analysis & Market Insights:
What Does the Soda Ash Price Index Indicate in 2026?
The Soda Ash Price Index reflects a gradual decline in Q2 2026 compared to Q1, indicating easing cost pressures and improved supply conditions. It helps buyers track overall market direction and pricing trends.
How Does the Soda Ash Price Chart Help Procurement Decisions?
The Soda Ash Price Chart provides historical price movements, enabling buyers to identify trends and optimal purchasing windows. It highlights past volatility and current stabilization patterns.
What Is the Soda Ash Price Forecast 2026 for Global Markets?
The soda ash price forecast 2026 suggests stable to slightly declining prices over the next year. Balanced supply-demand dynamics and moderate energy costs are expected to support this trend.
Conclusion
Soda ash prices in Q2 2026 showed a controlled downward trend, supported by improved supply conditions and stable industrial demand. Regional variations remain, but overall market volatility has decreased significantly.
With balanced fundamentals expected to continue, pricing is likely to remain stable in the near term. Procurement teams should monitor energy costs and demand indicators to optimize sourcing strategies and maintain cost efficiency.
Contact Us:
IMARC Group
134 N 4th St., Brooklyn, NY 11249, USA
Email: sales[@]imarcgroup.com
Tel No:(D) +91 120 433 0800
United States: +1- 201971-6302

 English
 Arabic
 French
 Spanish
 Portuguese
 Deutsch
 Turkish
 Dutch
Dutch
 Russian
 Romaian
 Portuguese (Brazil)
 Greek
Greek