Quicklime Price Chart 2026: Historical Data, Trends and Forecast Insights
The global Quicklime Price Trend in Q1 2026 showed a stable to slightly upward movement, supported by consistent demand from construction, steel, and environmental applications. The Quicklime Price Chart reflected a gradual rise across key regions, indicating balanced supply and steady consumption.
Regionally, China recorded USD 156/MT, the Netherlands reached USD 170/MT, the United States stood at USD 128/MT, France was priced at USD 145/MT, and South Africa reported the highest level at USD 247/MT. Compared to Q4 2025, prices increased by approximately 3%–6%, driven by rising energy costs and steady industrial demand.
These trends highlight a controlled pricing environment with moderate growth during the first quarter of 2026.
Quicklime Price Chart Analysis
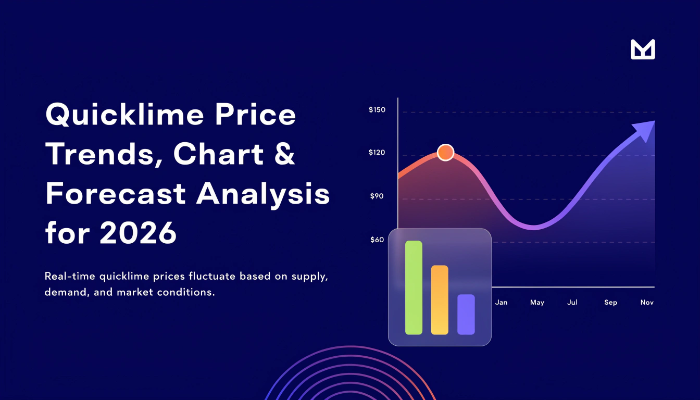
A closer look at the Quicklime Price Chart for Q1 2026 shows a gradual upward trajectory throughout the quarter. Prices increased steadily from January to March, with March marking the peak across most regions.
The lowest price point was observed in the United States at USD 128/MT, supported by a stable domestic supply and efficient production. In contrast, South Africa recorded the highest price at USD 247/MT, largely due to higher transportation and production costs.
Compared to Q4 2025, the chart reflects a noticeable upward shift. However, the increase was smooth rather than volatile, suggesting stable demand and manageable supply conditions. This trend provides clarity for buyers and helps in better planning.
Quicklime Price Trend Q1 2026
Global pricing during Q1 2026 remained firm, with slight increases observed across all major regions. The overall quicklime price trend was influenced by steady demand from infrastructure projects, steel manufacturing, and water treatment applications.
Energy costs, particularly for lime kilns, played a significant role in shaping price movements. Additionally, consistent raw material availability helped prevent sharp price spikes, maintaining a balanced market environment.
The trend indicates a stable pricing pattern with gradual upward movement supported by industrial demand.
Regional Price Analysis
North America
In North America, the United States recorded USD 128/MT, reflecting relatively lower pricing compared to other regions. Stable supply and steady demand from construction and environmental sectors supported price stability.
Europe
European markets showed moderate price levels, with the Netherlands at USD 170/MT and France at USD 145/MT. Higher energy costs and environmental regulations contributed to pricing differences across the region.
Asia-Pacific
China reported USD 156/MT, indicating stable production and strong domestic demand. The region maintained balanced pricing, supported by steady consumption in steel and construction industries.
Regional Price Snapshot (Q1 2026)
- China: USD 156/MT
- Netherlands: USD 170/MT
- USA: USD 128/MT
- France: USD 145/MT
- South Africa: USD 247/MT
This pricing snapshot highlights noticeable regional variations. South Africa recorded the highest price due to elevated production and logistics costs, while the United States maintained the lowest level with stable supply conditions. Europe and Asia-Pacific showed moderate pricing, reflecting balanced demand and supply across industrial sectors during Q1 2026.
Key Market Drivers
- Rising energy costs affecting lime production
- Stable demand from construction and steel industries
- Consistent availability of limestone raw materials
- Growth in environmental applications such as water treatment
- Transportation and logistics cost fluctuations
- Regional regulatory requirements impacting production costs
Quicklime Price Forecast 2026
The Quicklime price forecast 2026 indicates a steady outlook with gradual price increases expected throughout the year. Demand from infrastructure and industrial sectors is likely to remain strong, supporting pricing stability.
While supply conditions are expected to stay balanced, energy costs may continue to influence price levels. Improvements in production efficiency could help offset some cost pressures.
Overall, the forecast suggests moderate growth with limited volatility, providing a predictable environment for buyers and suppliers.
Quicklime Price Index & Historical Comparison
The Quicklime Price Index serves as a key indicator for tracking price movements over time. In Q1 2026, the index showed a moderate increase compared to previous quarters, reflecting stable demand and rising production costs.
When compared with the quicklime price history chart, current prices are slightly higher than earlier years but remain within a stable range. This indicates a controlled pricing environment with reduced volatility.
Historical patterns suggest that quicklime prices have become more predictable, helping industries plan procurement strategies more effectively.
Impact on Related Industries
Changes in quicklime prices have a direct impact on several downstream sectors. The construction industry may experience increased material costs, influencing project budgets.
Steel manufacturing, which relies on quicklime for refining processes, may also see cost adjustments. Additionally, water treatment and environmental applications could face slight cost increases due to pricing changes.
These effects highlight the importance of stable pricing for maintaining balance across related industries.
FAQs About Quicklime Price Insights & Trends Analysis:
What is the Quicklime Price Index in Q1 2026?
The Quicklime Price Index in Q1 2026 showed a moderate increase, supported by steady industrial demand and rising energy costs.
How does the Quicklime Price Chart reflect current trends?
The Quicklime Price Chart indicates a gradual upward trend during Q1 2026, with steady monthly increases and peak pricing observed in March.
What is the Quicklime price forecast 2026?
The Quicklime price forecast 2026 suggests stable to slightly increasing prices, driven by consistent demand and energy cost factors.
Stay Ahead with Latest Price Trends – Grab Your Sample Today:
https://www.imarcgroup.com/quicklime-pricing-report/requestsample
Conclusion: Key Insights and Future Outlook
During Q1 2026, quicklime prices showed a steady upward movement across global regions. South Africa recorded the highest price levels, while the United States remained the most stable and cost-effective market.
The overall pricing environment remained balanced, supported by steady demand and controlled supply. Looking ahead, prices are expected to continue a gradual upward trend, influenced by energy costs and industrial demand.
According to IMARC Group, the quicklime industry is set to maintain stable growth, offering predictable pricing trends for stakeholders throughout 2026.
Contact Us:
IMARC Group
134 N 4th St., Brooklyn, NY 11249, USA
Email: sales[@]imarcgroup.com
Tel No:(D) +91 120 433 0800
United States: +1-201971-6302